1.4 Examples in Python
In this chapter, we present code examples in Python to draw successive approximations of the Cantor’s Dust, the Sierpinski Triangle and the Sierpinski Carpet.
Anyone can reproduce the described fractals on their own computer. For this purpose, you can install a Python programming language interpreter. The codes that generate fractals are short, and their understanding is possible without any prior knowledge of this language, although, of course, it is worth knowing this language.
Here is some information to help you understand the codes:
- The following examples use the
matplotliblibrary, which includes functions for drawing, such as theplot()function for drawing a segment andfill()for drawing filled polygons, here a triangle and a square. Thefigure()function creates a blank graph, andshow()displays it on the screen. - More complex math functions can be found in the
mathlibrary. We will use the square root functionsqrt()in these examples. - The
numpylibrary contains functions for operations on vectors and matrices. We will use it to simplify the notation of operations on two-element vectors – points coordinates. - In many places, we use recursion, that is, the situation when a function calls itself. New functions are defined using the keyword
def. One of the arguments of the presented recursive functions isdepth– it specifies how many times the function should call itself recursively.
1.4.1 Cantor dust
We will base the drawing of Cantor dust on the recursive function dust, which takes three arguments: x – the location from which to draw the fractal, scale – the size of the fractal, and depth – the current nesting level of the fractal.
# Required libraries.
import matplotlib.pyplot as plt
import numpy as np

# If depth=1, then we draw a line segment;
# if depth>1, then we draw two small copies of Cantor dust side by side.
def dust(x, scale, depth):
    if depth > 1:
        dust(x, scale / 3, depth - 1)
        dust(x + scale*2/3, scale / 3, depth - 1)
    else:
        plt.plot([x, x+scale], [0,0], color = "black")

# Initialize drawing and draw dust with depth of 5.
plt.figure()
dust(0, scale = 1, depth = 5)
plt.show()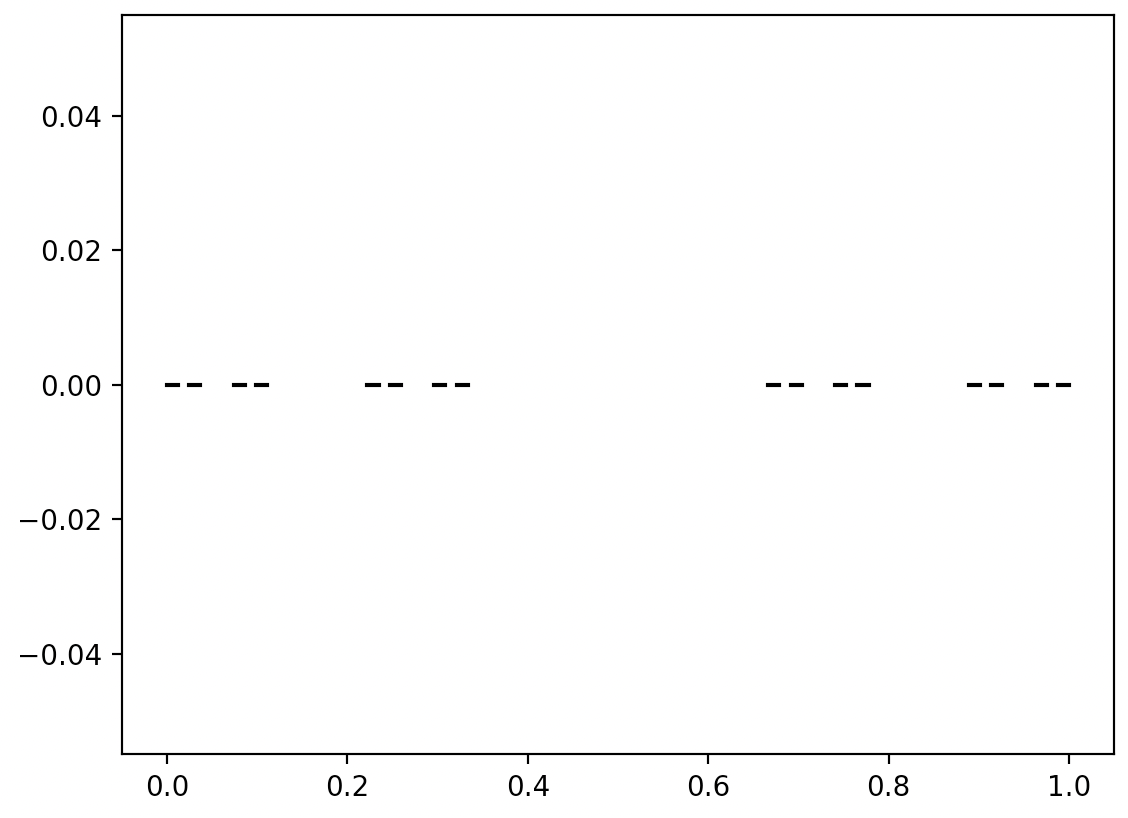
The result of executing the following instructions
1.4.2 Sierpinski triangle
It’s time for the iconic triangle. To draw it, we will use the recursive function sierpinski, which takes three arguments: x – the location from which to draw the fractal, scale – information about the size of the fractal, and depth – the current nesting level of the fractal.
import matplotlib.pyplot as plt
import numpy as np
import math

# We define a function that draws a triangle at point x and of side scale.
def triangle(x, scale):
    plt.fill([x[0], x[0]+scale, x[0]+scale/2],
        [x[1], x[1], x[1]+scale*np.sqrt(3)/2],
        color = "black")

# Recursive function to draw Sierpiński triangle.
# If depth=1, we draw a regular triangle,
# if depth>1, we draw three triangles side by side.
def sierpinski(x, scale, depth):
    if depth > 1:
        sierpinski(x, scale/2, depth-1)
        sierpinski(np.add(x, [scale/2, 0]),
            scale/2, depth-1)
        sierpinski(np.add(x,[scale/4,scale*np.sqrt(3)/4]),
            scale/2, depth-1)
    else:
        triangle(x, scale)

# Initialize the figure and draw a triangle with a depth of 4.
plt.figure()
sierpinski([0,0], scale = 1, depth = 4)
plt.show()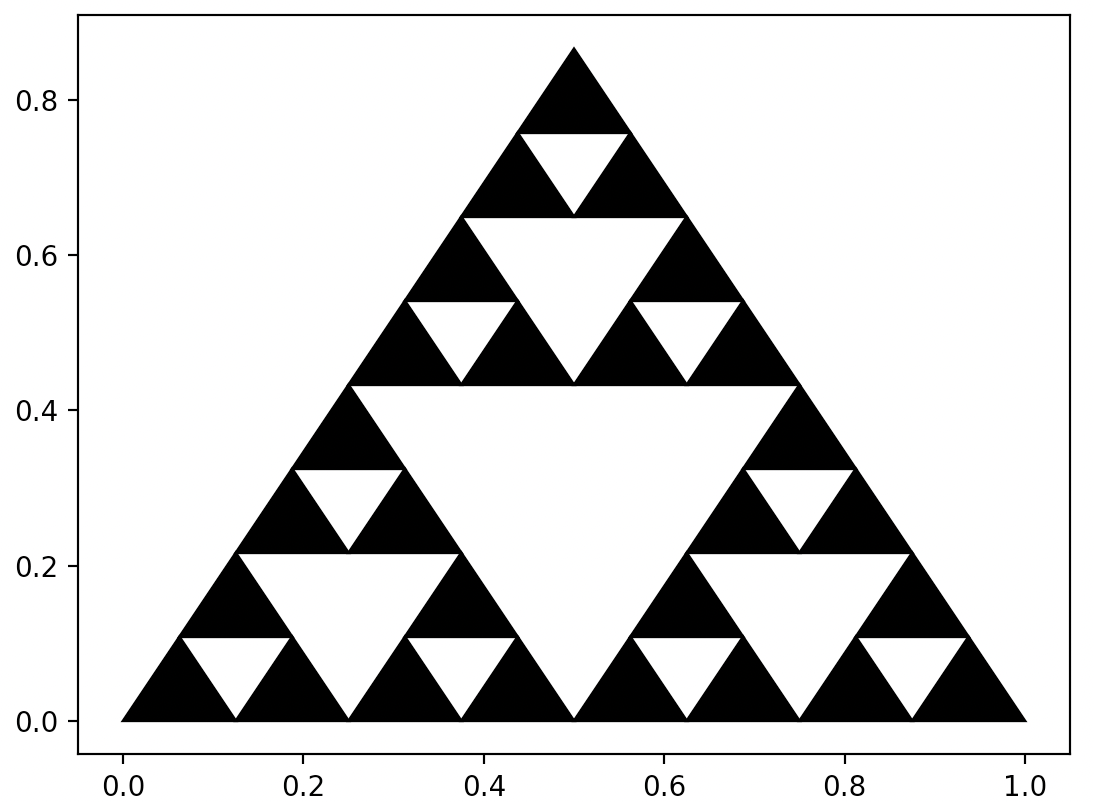
The result of executing the following instructions
1.4.3 Sierpinski carpet
The fractal structure proposed by Wacław Sierpiński can be repeated for other shapes, such as a square or pentagon.
Below is an example for a square with a hole, that is Sierpiński carpet.
import matplotlib.pyplot as plt
import numpy as np

# Recursive function to draw Sierpiński carpet.
# If depth=1, we draw a square using the square() function,
# if depth>1, we draw eight fractals side by side.
def square(x, scale):
    plt.fill(np.add(x[0], [0, scale, scale, 0]),
        np.add(x[1], [0 0, scale,scale]), color="black")
def carpet(x, scale, depth):
    if depth > 1:
        carpet(x, scale/3, depth-1)
        carpet(np.add(x, [scale/3,0]), scale/3,depth-1)
        carpet(np.add(x, [2*scale/3,0]), scale/3,depth-1)
        carpet(np.add(x, [0,scale/3]), scale/3,depth-1)
        carpet(np.add(x, [2*scale/3,scale/3]), scale/3,depth-1)
        carpet(np.add(x, [0,2*scale/3]), scale/3,depth-1)
        carpet(np.add(x, [scale/3,2*scale/3]), scale/3,depth-1)
        carpet(np.add(x, [2*scale/3,2*scale/3]), scale/3,depth-1)
    else:
        square(x, scale)

plt.figure()
carpet([0,0], scale = 1, depth = 4)
plt.show()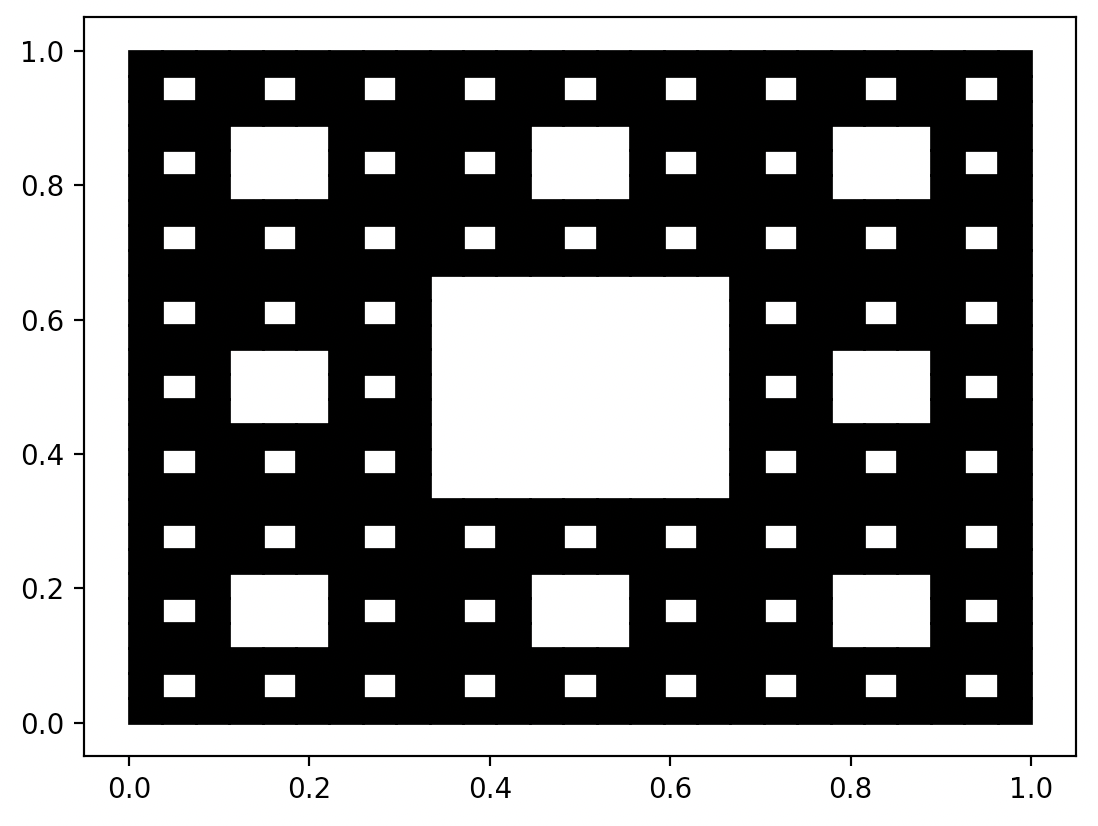
The result of executing the following instructions